The satellite image was received and processed by NASDA Japan,
and distributed by RESTEC Japan.
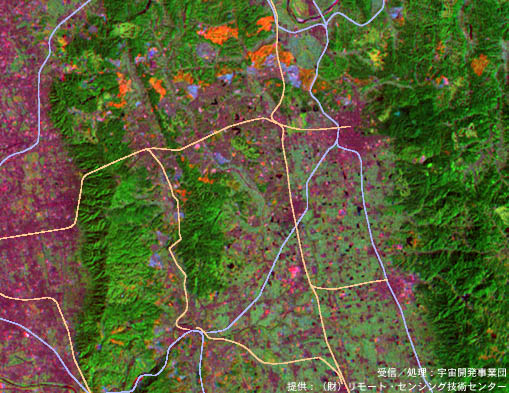
Blue and Orange lines denote major railway lines.
The image is composed of a band 5 (visible light) image of
1979 as the blue plane, a band 7 (infrared) image of 1979 as the
green plane, and a band 5 image of 1989 as the red plane. As urban
development proceeds, brightness on grayscale images using visible
light changes from dark (before development, covered by wood)
to bright (under construction, bare land) to gray (after development,
covered by buildings). As a result, newly urbanized areas are
highlighted as orange. Colors in the image indicate the types
of land cover and changes in land cover as shown in the following
table.
| Color | Land Cover in 1979 | Land Cover in 1989 |
| light blue | under construction | built up area |
| orange | wood | under construction |
| dark green | wood | wood |
| light green | rice field | rice field |
| magenta | densely built up area | densely built up area |
By Noboru Ogata, Emeritus, Kyoto University