![]()
Graduate School of Human and Environmental Studies, Kyoto University
Spatial Demography of the Tokyo Metropolitan Area — Analyses and Displays using mapRaster2
By Noboru Ogata
Tokyo, along with Kansai, is a major urban agglomeration in Japan having a densely inhabited old town and extensive suburbia. Since the 17th century when Edo (modern Tokyo) became the seat of shogun, it has been the political center of Japan and one of the largest cities in the world. In 1868, Edo was renamed Tokyo and became the capital of Japan. Today, it is a megacity of international scale performing not only political but also financial and cultural activities.
In this page, we present spatial demography of the Tokyo Metropolitan Area, and its change between 1980 and 2000 from the viewpoint of human spatial ecology. In order to show the spatial characteristics of the metropolis, we use here the demographic statistics compiled using the grid cells. The quadrangular area shown here was inhabited by about 24.8 million people in 1980 and 29 million in 2000. Although it contains some rural areas, these numbers approximate the population of the metropolitan area. Proportion of the young people under 15 in the quadrangular area was 23.66% in 1980, but the percentage fell to 13.22% in 2000 reflecting the general tendency of declining birth rate.
The pictures shown below include major JR (Japan Railways) lines to show geographical background. Because mapRaster2 do not provide function of treating line features, railway lines were drawn using another software, and then overlayed.
 |
Geomorphology and Land Use |
|
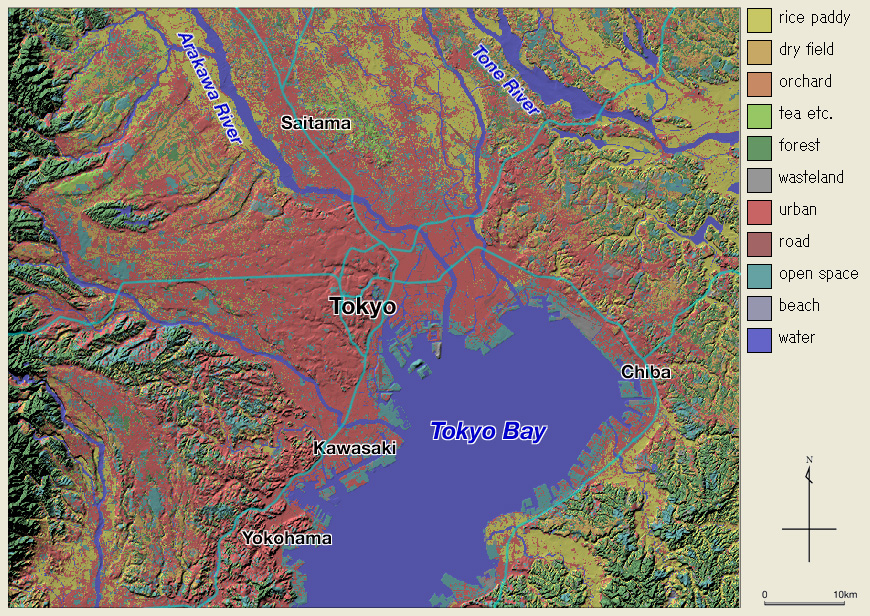
| Synoptic view of the Tokyo Metropolitan Area. This map is composed of hillshading from digital elevation model (DEM) with land use data draped in color. We can observe that the city of Tokyo extends around the point where the Musashino diluvial terrace extending from the west meets the river mouth of Arakawa river. |
 |
 |
|
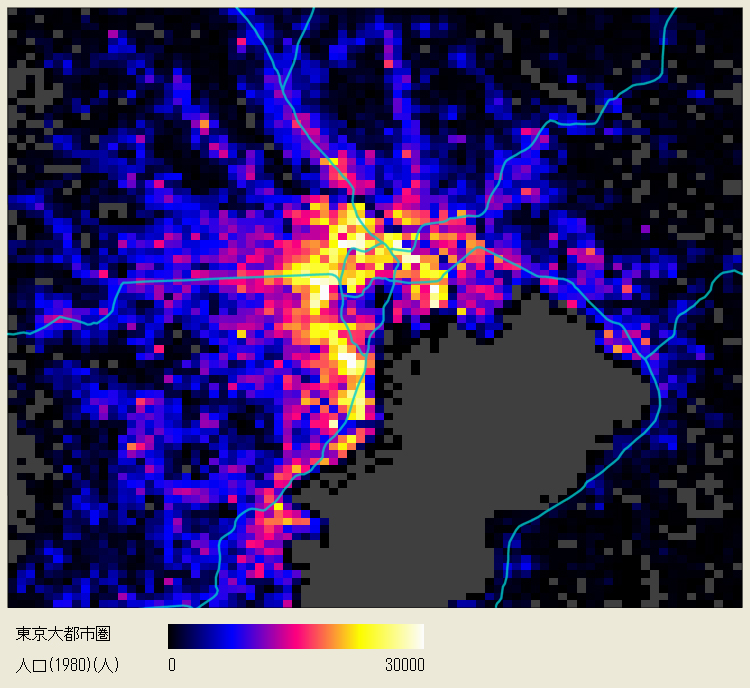
Spatial distribution of population in the Tokyo Metropolitan Area in 1980. Population counted for each grid cell indicates approximate population density per square kilometer. We can observe "the ring" of high population density encircling the city center. The density declines toward the periphery. |
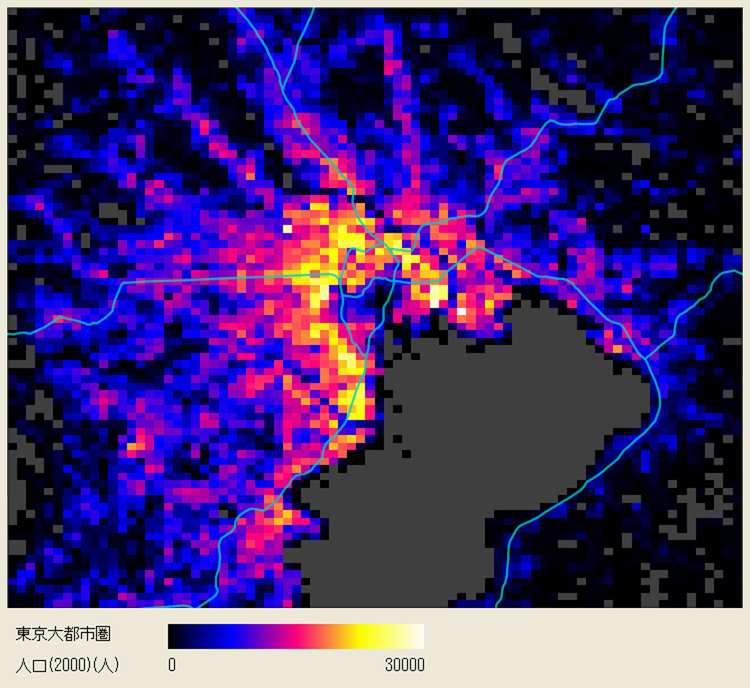
Population distribution in 2000. We can summarize the change during the two decades that the density of "the ring" decreased, indicating those population dispersed toward the suburbia. |
 |
Rate of population change (1980 – 2000) |
|
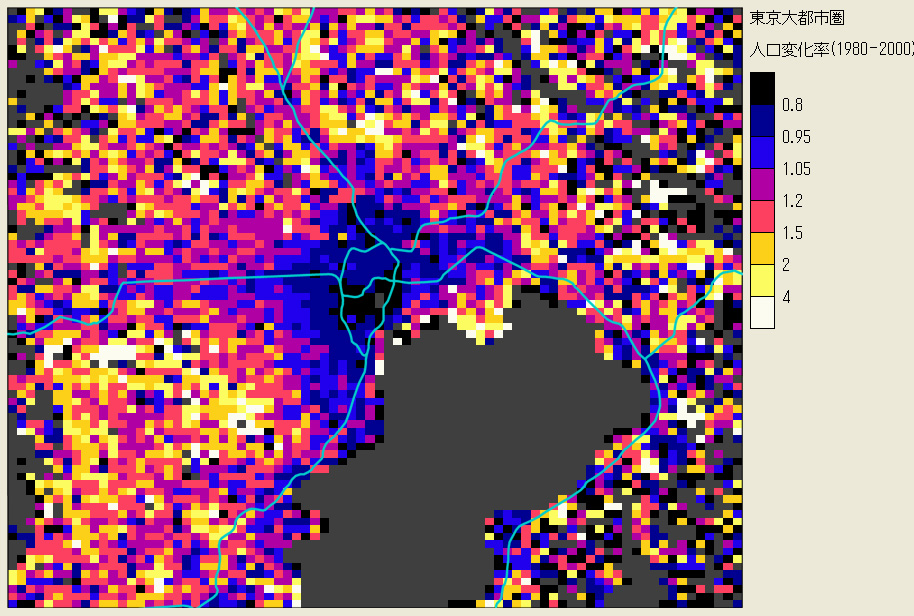
| Rate of the population change between 1980 and 2000. During the period, population decreased in the inner areas of Tokyo, while increased in the suburbia. It is also notable that seaside areas eastward from the city center gained new inhabitants. These are newly built residential districts composed mostly of condominiums. |
 |
 |
|
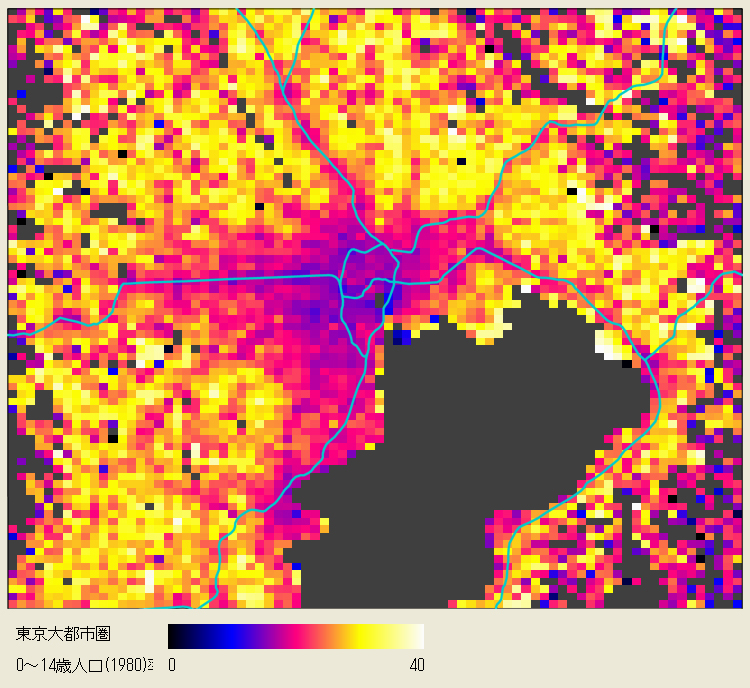
Proportion of the young people under 15 in 1980. Spatial pattern with low value in the inner areas (the old town) and high value in the periphery (the suburbia) can be considered general phenomena often observed in growing large cities. |
Proportion of the young people under 15 in 2000. The general spatial pattern seen in 1980 has collapsed. Fall in the birth rate and economic stagnation during the 1990's changed demography of Tokyo. We can observe several areas including many households growing children as if they were "islands" in the sea of aging metropolis. |
 |
Distribution of Shops (2002) |
|
| Distribution of shops (number of retailing facilities) based on the data from 2002 Census of Commerce. Distribution of shops can naturally be imagined to follow the distribution of population. However, shops tend to gather one another to form shopping clusters. Moreover, these clusters generally spring up evenly spaced of which processes are studied in the central place theory of economic geography. In addition to the traditional shopping center of Nihombashi-Ginza (Downtown in the American terminology), we can observe ‘the new metropolitan subcenters’ of Ikebukuro, Shinjuku and Shibuya lining along the western side of the Yamanote (Loop) railway line. Even outer of the city, shopping clusters such as Funabashi, Ômiya (Saitama City), Kichijôji (Musashino City) and others are located. Yokohama, originally an independent urban center, is now partly suburbs of Tokyo. |
After adopting the global geodetic system in 2002, the longitude-latitude coordinate system and grid-cells were shifted for several hundred meters. Therefore we cannot compare the population distributions before and after that time. The following pictures are of the newer knowledge about population distribution and its change of the Tokyo Metropolitan Area. (items added on September 1, 2018)
|
 |
|
Population distribution in 2015. While total population of the country has been declining, the Tokyo Metropolitan Area has gathered even more people. The population of the above quadrangular area has increased up to about 32 million. |
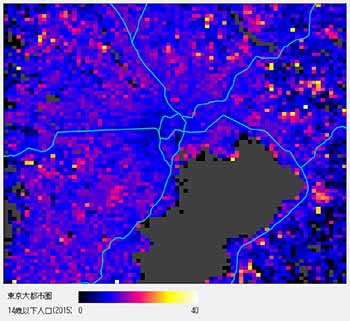
Proportion of the young people under 15 in 2015. The aging of the population is still advancicng. The avarage proportion of the young people under 15 in the above area is 12.05%. |
 |
Rate of population change (2005 – 2015) |
|
| Rate of the population change between 2005 and 2015. During the period, spatial pattern of the population change has dramatically changed. While some suburban areas, which gathered population in 1980’s, lost their population, the central area of Tokyo increased their population. We can now see many newly built high-rise buildings for residences there. |
Updated : September 1, 2018
![]()