Graduate School of Human and Environmental Studies, Kyoto University
Socio-Economic Variables of the Kansai Metropolitan Area — Analyses
and Displays using mapRaster2
By Noboru Ogata
Kansai (Keihanshin) Metropolitan Area is Japan’s second largest urban
agglomeration after Tokyo. It includes
Osaka, Kyoto, Kobe, Nara and many other cities. Kansai had been the key area
through Japanese history. In the 8th century, Nara was the capital of Japan,
and this position was taken over by Kyoto in 794. Thereafter, Kyoto had
been the seat of the imperial court until 1868. In the 17th century
when Edo (modern Tokyo) became the political center, shogun’s government gave
Osaka the position of the center of domestic trading. Accordingly, Osaka and
Kyoto continued to be the important places of commerce, manufacture and culture
during the Edo period (1603 - 1868). Osaka led Japan’s industrial revolution
in the late 19th and early 20th centuries, but since the latter half of the
20th century, Kansai has gradually fallen behind Tokyo in the economy and other
aspects.
The following pictures are displays of socio-economic
variables of the Kansai Metropolitan Area. Each variable
is from grid-square statistics and displayed
in color on a surface model of the area created from
digital elevation model (DEM) supplied by the Geographical
Survey
Institute of Japan. The surface models are
viewed from the southwest over Osaka Bay
and the elevation is exaggerated two-fold.
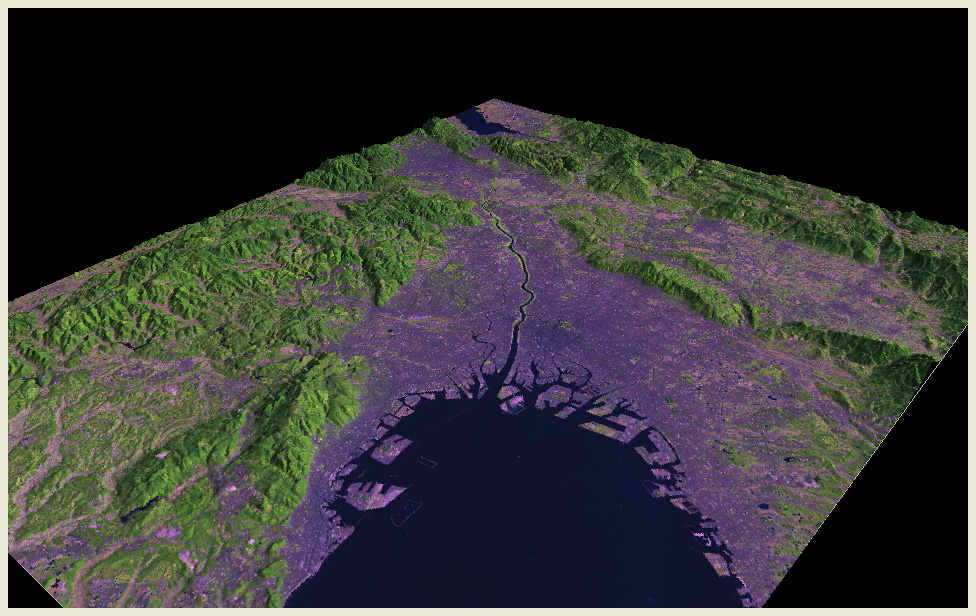
General Landscape (data
from LANDSAT 7 ETM+ acquired on 25/Aug/2000)
Earth observation satellite imagery of LANDSAT 7 is draped over the
surface model. The satellite data was received by JAXA
Japan and distributed by RESTEC
Japan. |
|
 |
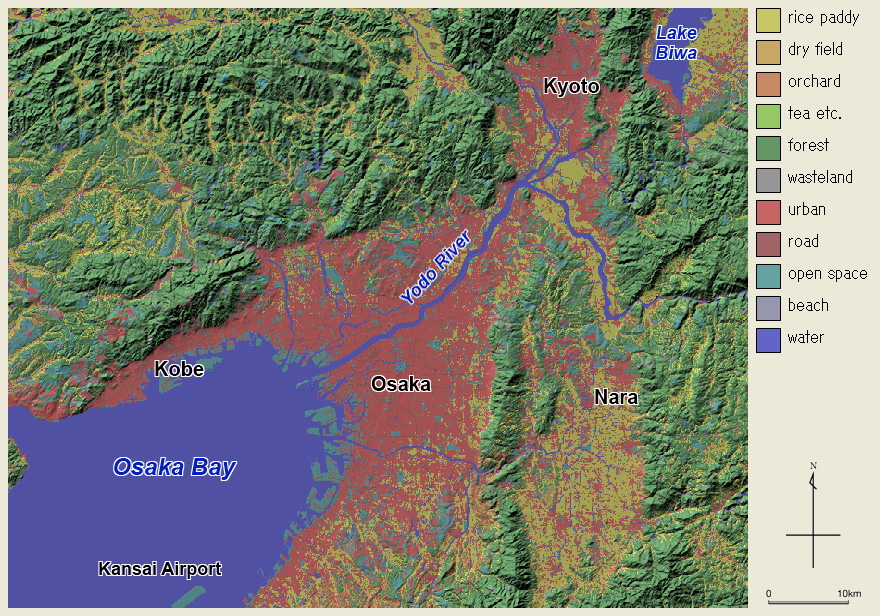
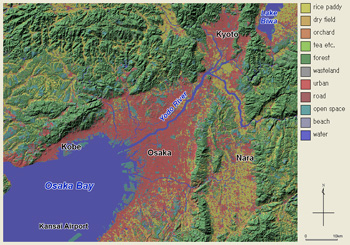
Land Use (data
from the Geographical Survey Institute of Japan)
Land use categories are displayed in colors. This area contains about
15.8 million inhabitants according to the population census of 2000
(see below).
This chart provides general background information of the study area.
Please click the thumbnail. |
|
 |
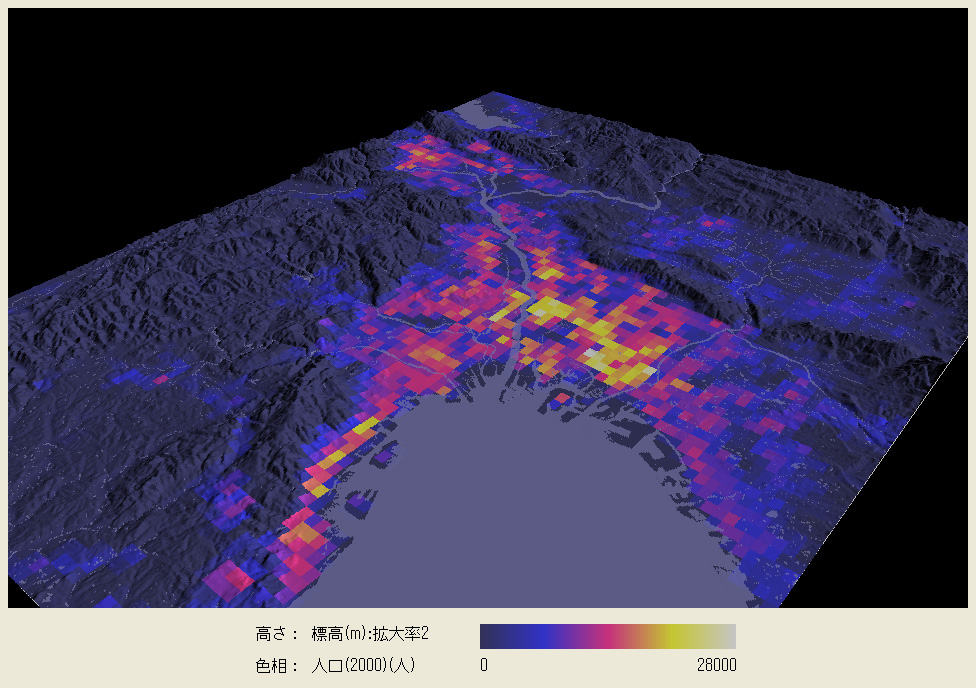
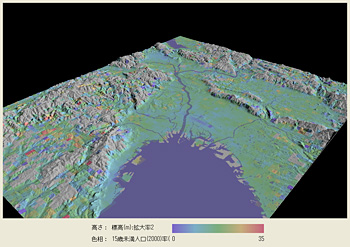
Population (data
from the 2000 Population Census)
Population enumeration by the 1-kilometer grid-square denotes
approximate population density. The 1-kilometer grid-square is
not exactly of that size because it is delimited by the lines
of latitude and longitude.
|
|
 |
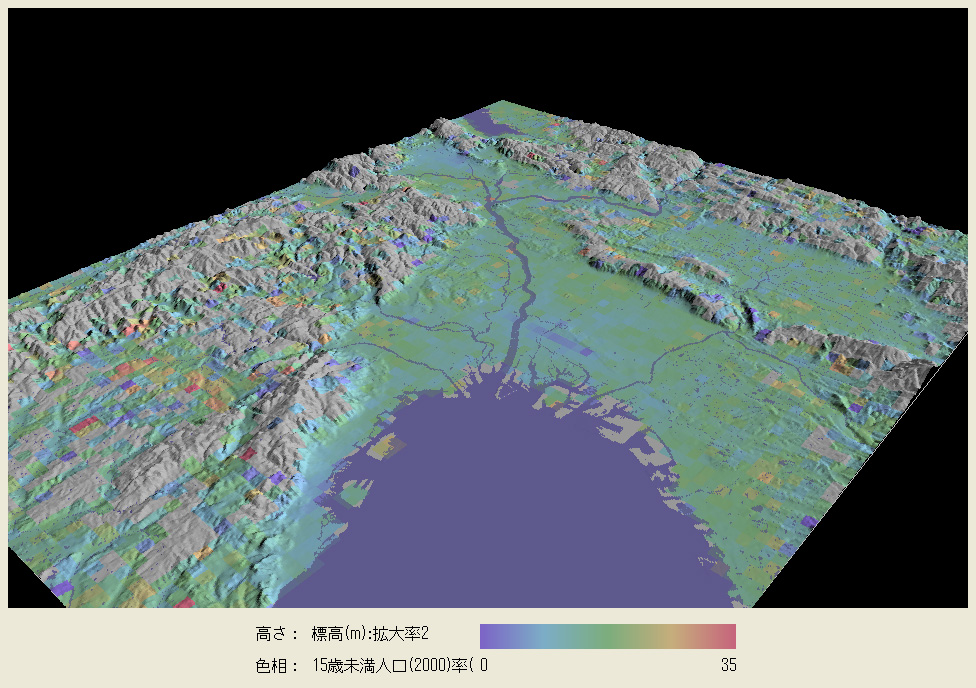
Proportion of
the young (data from the 2000 Population Census)
Proportion of the population under 15 in the total population
is shown. It shows general spatial pattern with low values in
the inner areas of Osaka, Kyoto and Kobe, and high values in
the suburban areas.
However, reflecting the decline of birth rate in the national
scale in the recent decades, proportion of the young people is
generally low in the study area and regions containing many young
people are limited to a few districts including newly developed
suburbia such as Sanda (north of Kobe) and Keihanna (hilly areas
in the middle of Kyoto, Osaka and Nara) districts. |
|
 |
Proportion of
the young (data from the 1980 Population Census)
Proportion of the young population from 1980 census. The contrasts
in the value between inner areas and suburbia are more remarkable
than the above example from 2000 census. This concentric pattern
is considered general phenomenon, reflecting urban spatial
ecology of growing metropolitan areas. |
|
 |
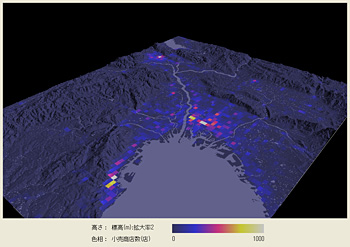
Number of the
retailing facilities (data from the 2002 Census of Commerce)
Retailing facilities (shops) are densely located in the central
areas of Osaka (Kita = the North and Minami = the South), Kyoto
and Kobe. |
|
 |
Updated : July 23, 2011